Security
An application developer is primarily responsible for implementing four different aspects of security:
- authentication, verifying the identity of the application or human that’s attempting to access the application. For example, an application typically verifies a principal’s credentials, such as a user ID and password or an application’s API key and secret
- authorization, verifying that the principal is allowed to perform the requested operation on the specified data. Applications often use a combination of role-based security and access control lists (ACLs). Role-based security assigns each user one or more roles that grant them permission to invoke particular operations. ACLs grant users or roles permission to perform an operation on a particular business object, or aggregate
- auditing, tracking the operations that a principal performs in order to detect security issues, help customer support, and enforce compliance
- secure interprocess communication, ideally, all communication in and out of services should be over Transport Layer Security (TLS). Interservice communication may even need to use authentication
authentication and authorization
When a user logs in with their user ID and password, the client makes a POST request containing the user’s credentials to the application. The application verifies the credentials and returns a session token to the client. The client includes the session token in each subsequent request to the application.
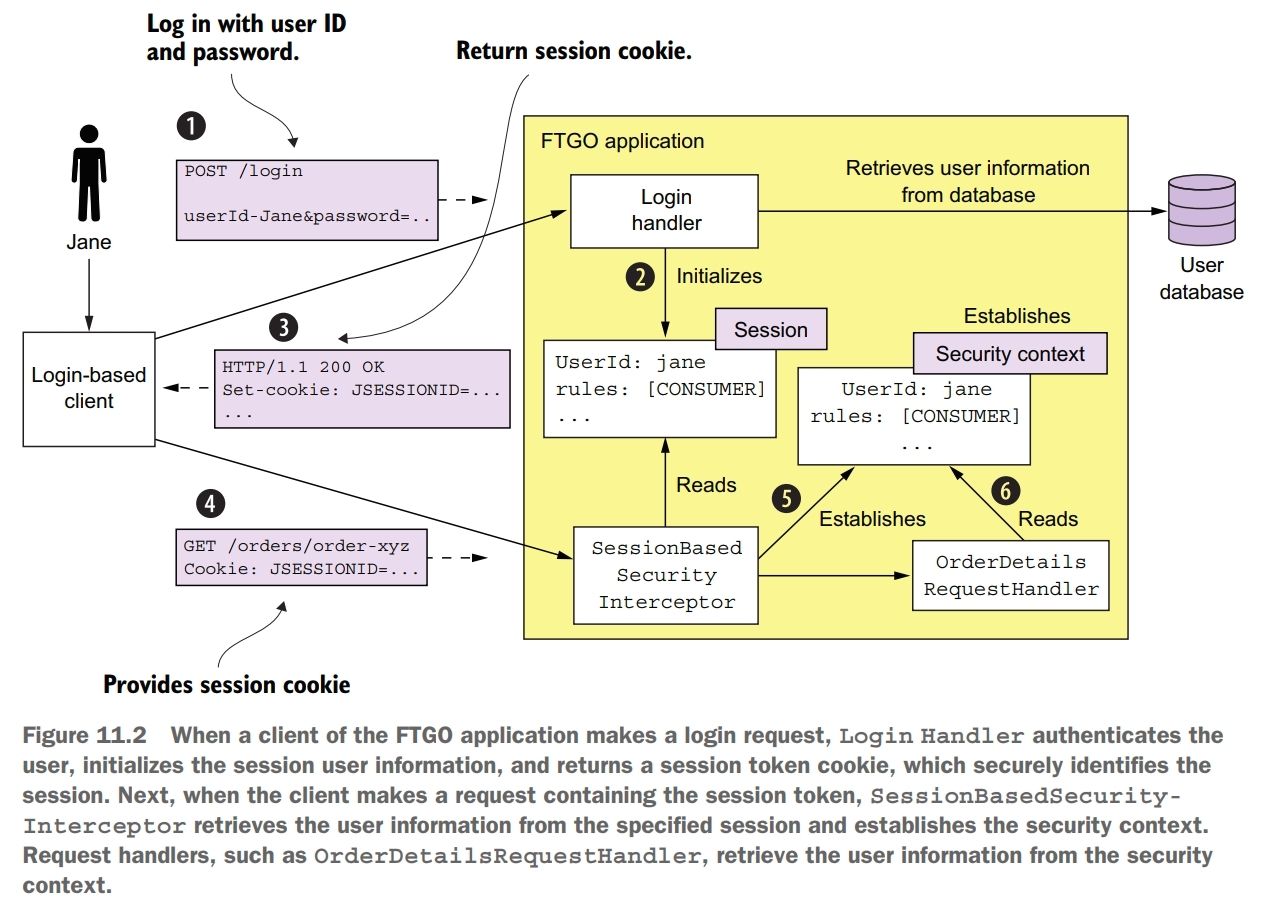
One key part of the security architecture is the session, which stores the principal’s ID and roles. A session is identified by a session token, which the client includes in each request. It’s usually an opaque token such as a cryptographiclly strong random number. The other key part of the security implementation is the security context, which stores information about the user making the current request.
One drawback of using an in-memory session is that it requires all requests for a particular session to be routed to the same application instance. This requirement complicates load balancing and operations. You must, for example, implement a session draining mechanism that waits for all sessions to expire before shutting down an application instance. An alternative approach, which avoids these problems, is to store the session in a database.
You can sometimes eliminate the server-side session entirely. For example, many applications have API clients that provide their credentials, such as an API key and secret, in every request. As a result, there’s no need to maintain a server-side session.
In order to implement security in a microservice architecture we need to determine who is responsible for authenticating the user and who is responsible for authorization. A commonly used approach is for the API gateway to authenticate a request before forwarding it to the services. Centralizing API authentication in the API gateway has the advantage that there’s only one place to get right. As a result, there’s a much smaller chance of a security vulnerability. Another benefit is that only the API gateway has to deal with the various different authentication mechanisms. It hides this complexity from the services.
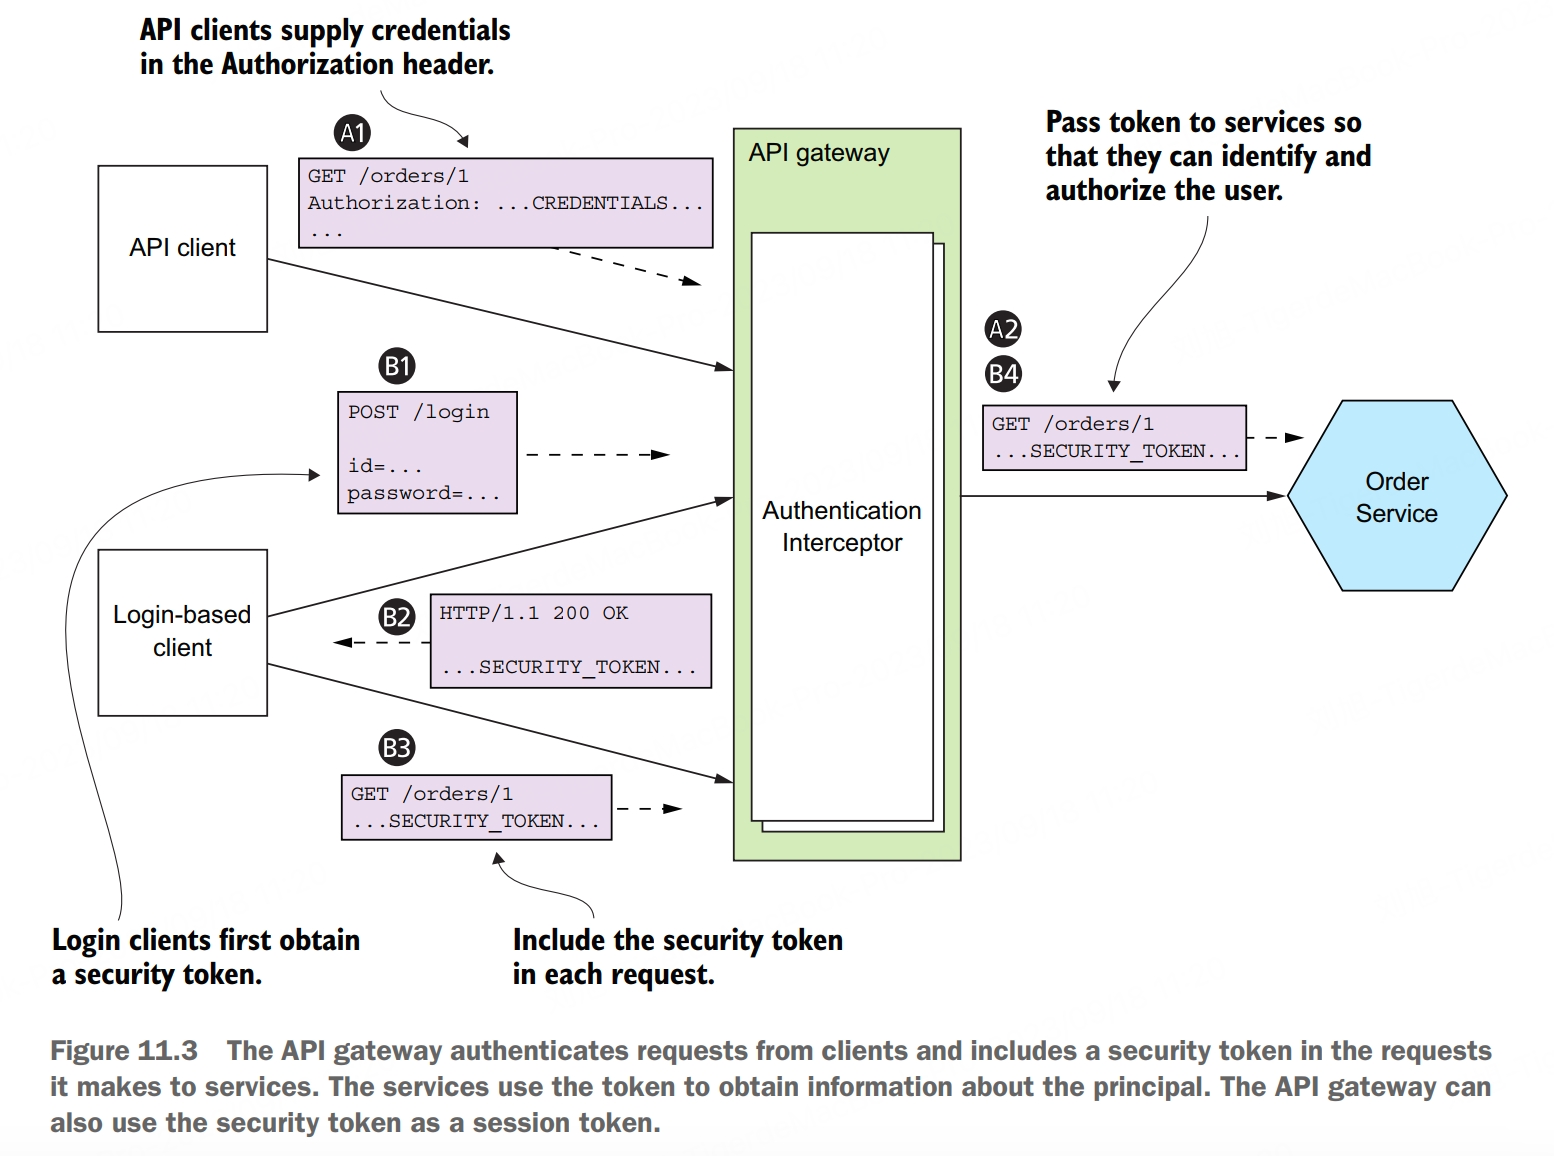
Clients authenticate with the API gateway. API clients include credentials in each request. Login-based clients POST the user’s credentials to the API gateway’s authentication and receive a session token. Once the API gateway has authenticated a request, it invokes one or more services. A service invoked by the API gateway needs to know the principal making the request. It must also verify that the request has been authenticated. The solution is for the API gateway to include a token in each service request. The service uses the token to validate the request and obtain information about the principle. The API gateway might also give the same token to session-oriented clients to use as the session token.
Access token pattern: the API gateway passes a token containing information about the user, such as their identity and their roles, to the services that it invokes.
Authenticating a client’s credentials is important but insufficient. An application must also implement an authorization mechanism that verifies that the client is allowed to perform the requested operation. It is not recommended to implement authorization in the API gateway. One drawback of implementing authorization in the API gateway is that it risks coupling the API gateway to the services, requiring them to be updated in lockstep. What’s more, the API gateway can typically only implement role-based access to URL paths. It’s generally not practical for the API gateway to implement ACLs that control access to individual domain objects, because that requires detailed knowledge of a service’s domain logic. It is more recommended to implement authorization in the services. A service can implement role-based authorization for URLs and for service methods. It can also implement ACLs to manage access to aggregates.
JWT
When implementing security in a microservice architecture, you need to decide which type of token an API gateway should use to pass user information to the services. There are two types of tokens to choose from. One option is to use opaque tokens, which are typically UUIDs. The downside of opaque tokens is that they reduce performance and availability and increase latency. That’s because the recipient of such a token must make a synchronous RPC call to a security service to validate the token and retrieve the user information.
An alternative approach, which eliminates the call to the security service, is to use a transparent token containing information about the user. One such popular standard for transparent tokens is the JSON Web Token (JWT). JWT is standard way to securely represent claims, such as user identity and roles, between two parties. A JWT has a payload, which is a JSON object that contains information about the user, such as their identity and roles, and other metadata, such as an expiration date. It’s signed with a secret that’s only known to the creator of the JWT, such as the API gateway and the recipient of the JWT, such as a service. The secret ensures that a malicious third party can’t forge or tamper with a JWT.
OAuth 2.0
OAuth 2.0 is an authorization protocol that was originally designed to enable a user of a public cloud service, such as GitHub or Google, to grant a third-party application access to its information without revealing its password. An important benefit of using OAuth 2.0 is that it’s a proven security standard. Although the original focus of OAuth 2.0 was authorizing access to public cloud services, you can also use it for authentication and authorization in your application.
The key concepts in OAuth 2.0 are the following:
- authorization server, provides an API for authenticating users and obtaining an access token and a refresh token. Spring OAuth is a great example of a framework for building an OAuth 2.0 authorization server
- access token, a token that grants access to a resource server. The format of the access token is implementation dependent. But some implementations, such as Spring OAuth, use JWTs
- refresh token, a long-lived yet revocable token that a client uses to obtain a new access token
- resource server, a service that uses an access token to authorize access. In a microservice architecture, the services are resource servers
- client, a client that wants to access a resource server. In a microservice architecture, API gateway is the OAuth 2.0 client
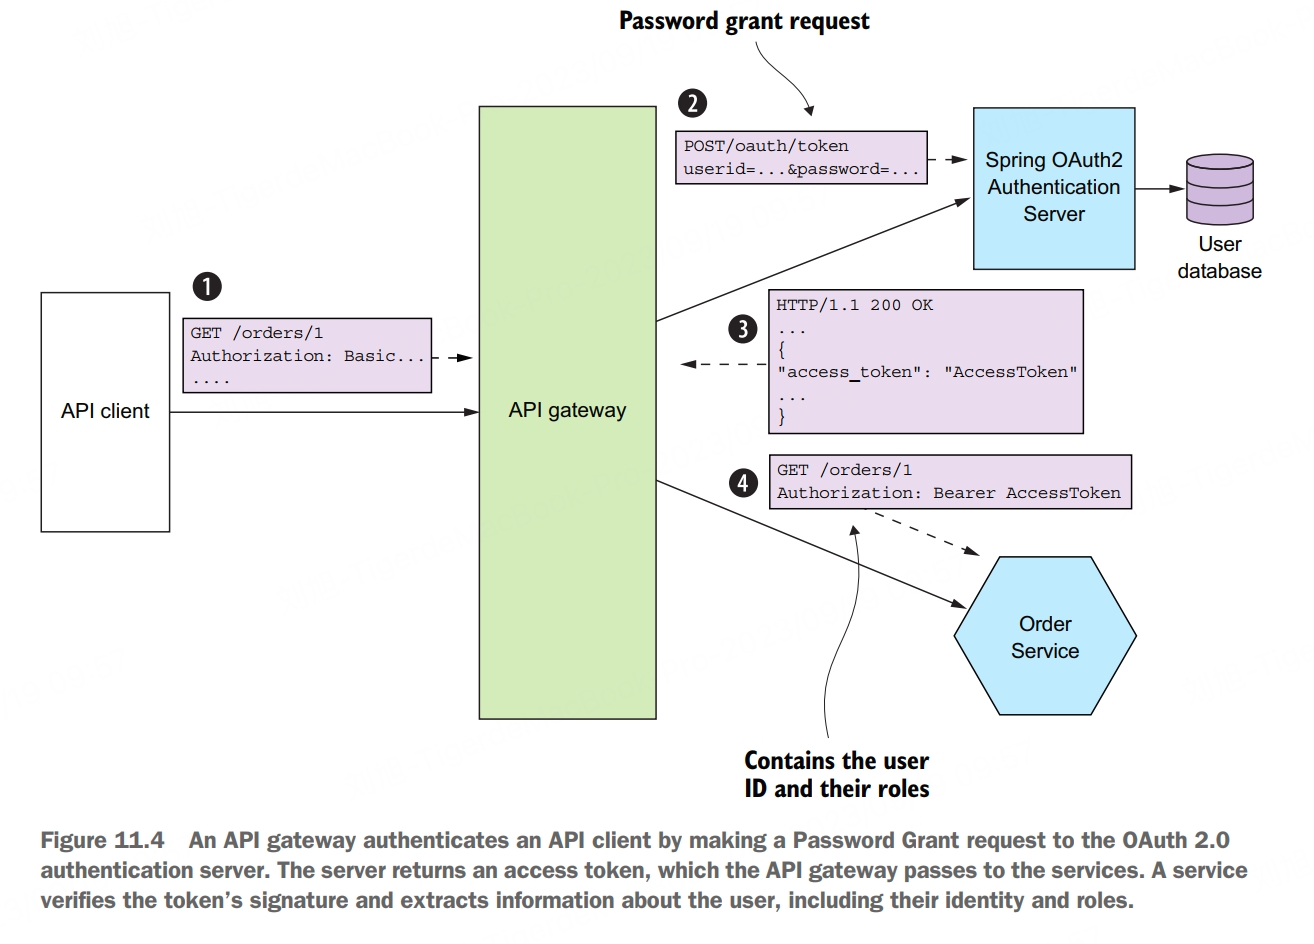
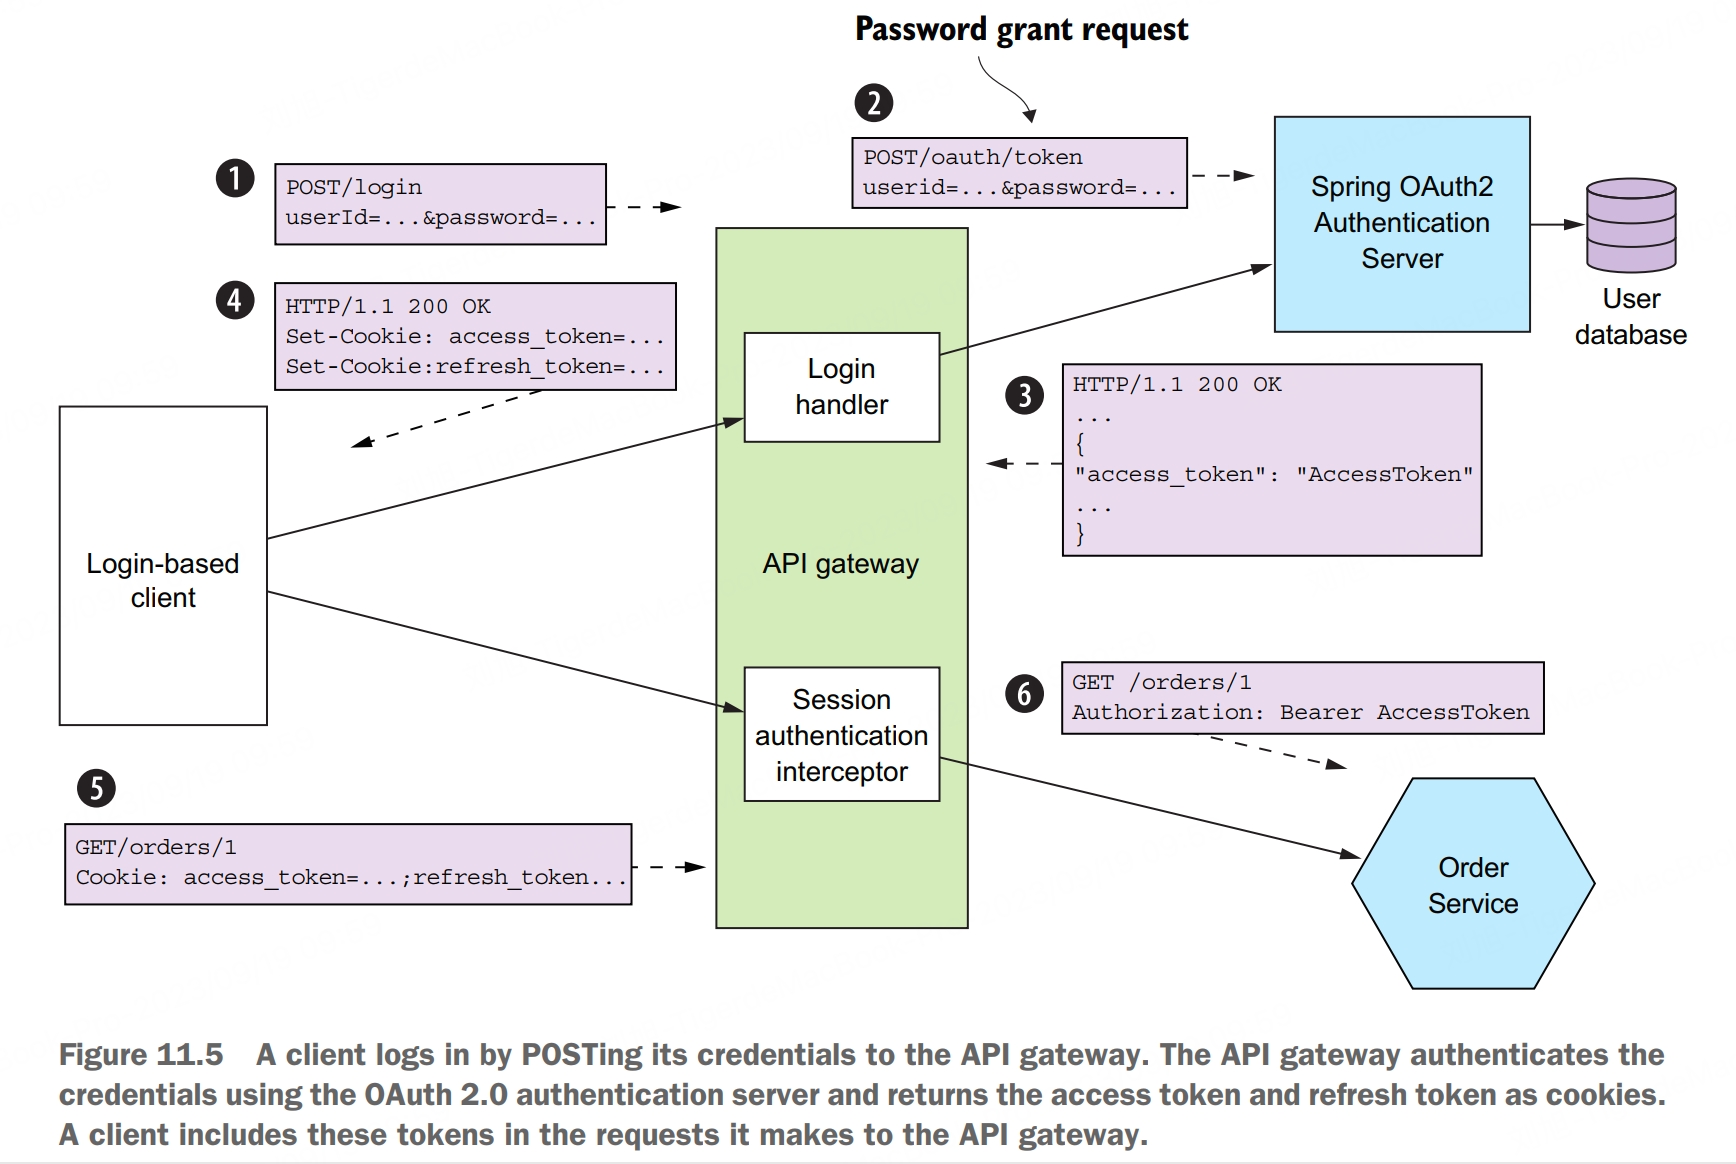
An important benefit of using OAuth 2.0 is that it’s a proven security standard. Using an off-the-shelf OAuth 2.0 authentication server means you don’t have to waste time reinventing the wheel or risk developing an insecure design.
Configurable Services
Externalized configuration pattern: supply configuration property values, such as database credentials and network location, to a service at runtime.
An externalized configuration mechanism provides the configuration property values to a service instance at runtime. There are two main approaches:
- push model, the deployment infrastructure passes the configuration properties to the service instance using, for example, operating system environment variables or a configuration file
- pull model, the service instance reads its configuration properties from a configuration server
The push model relies on the collaboration of the deployment environment and the service. The deployment environment supplies the configuration properties when it creates a service instance. The service instance then reads the configuration properties when it starts up. The push model is an effective and widely used mechanism for configuring a service. One limitation, however, is that reconfiguring a running service might be challenging, if not impossible. The deployment infrastructure might not allow you to change the externalized configuration of a running service without restarting it. Another limitation is that there’s risk of the configuration property values being scattered throughout the definition of numerous services. As a result, you may want to consider using a pull model.
In the pull model, a service instance reads its configuration properties from a configuration server.
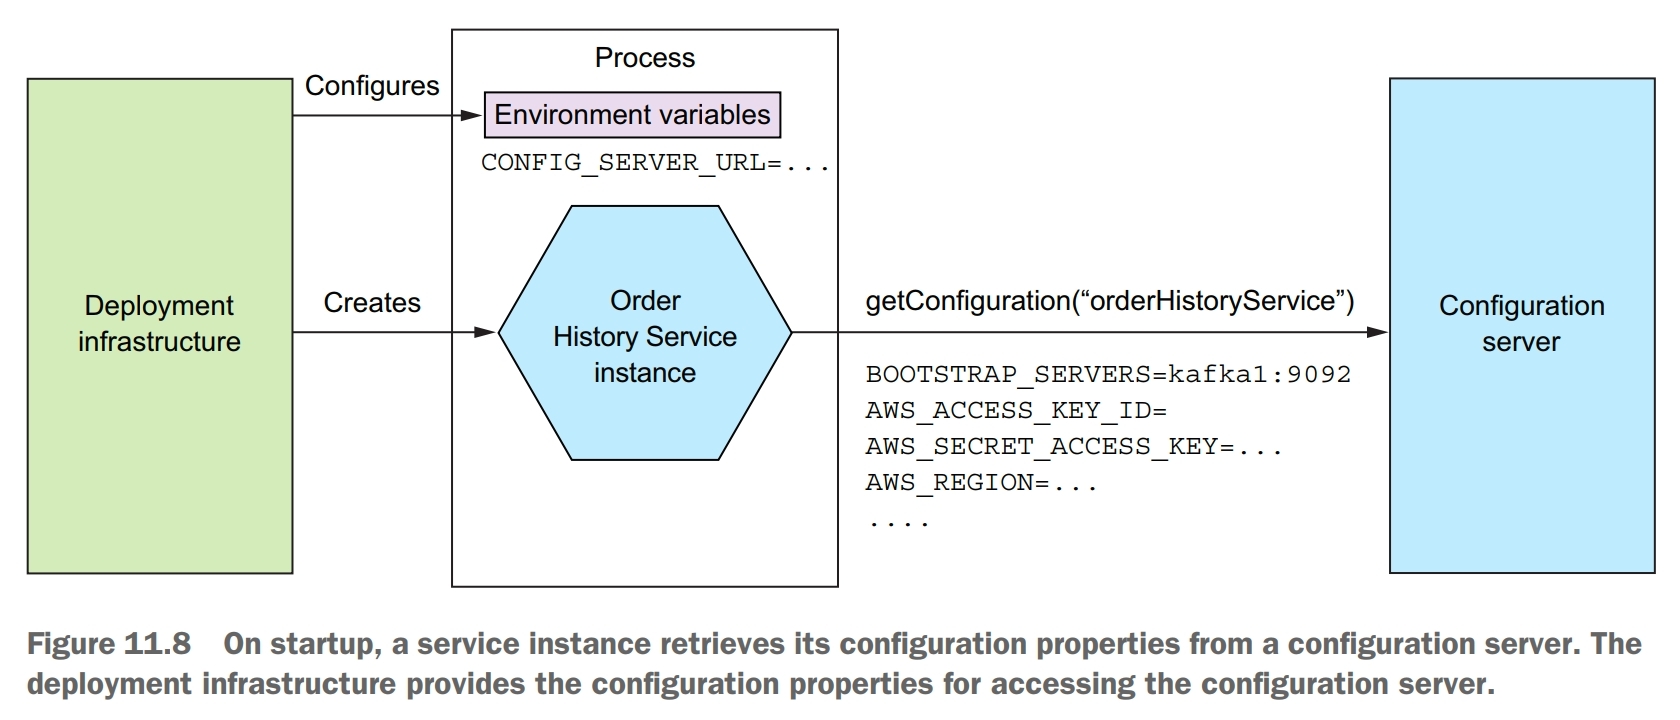
The primary drawback of using a configuration server is that unless it’s provided by the infrastruture, it’s yet another piece of infrastructure that needs to be set up and maintained. Fortunately, there are various open source frameworks, such as Spring Cloud Config, which make it easier to run a configuration server.
Observable Services
Many aspects of managing an application in production are outside the scope of the developer, such as monitoring hardware avaiability and utilization. These are clearly the responsibility of operations. But there are several patterns that you, as a service developer, must implement to make your service easier to manage and troubleshoot. These patterns expose a service intance’s behavior and health. They enable a monitoring system to track and visualize the state of a service and generate alerts when there’s a problem. These patterns also make troubleshooting problems easier.
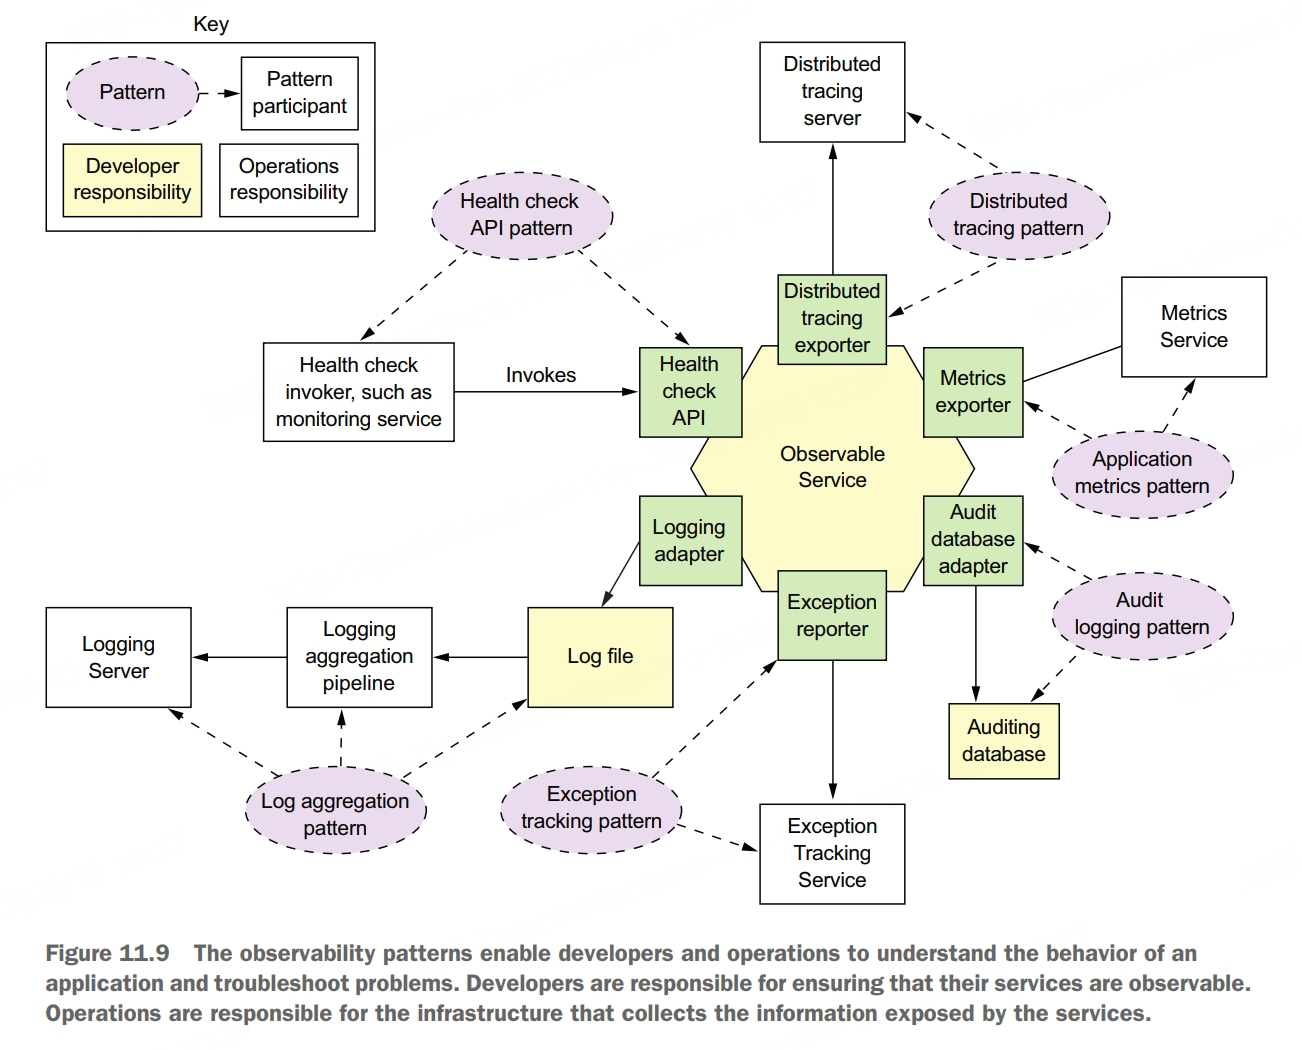
health check API pattern
A service exposes a health check API endpoint, such as GET /health, which returns the health of the service.
The deployment infrastructure periodically invokes this endpoint to determine the health of the service instance and takes the appropriate action if it’s unhealthy.
There are two issues you need to consider when using health checks. The first is the implementation of the endpoint, which must report back on the health of the service instance. The second issue is how to configure the deployment infrastructure to invoke the health check endpoint.
A great example of a health check library is Spring Boot Actuator. It implements a /actuator/health endpoint. The code that implements this endpoint returns the result of executing a set of health checks. By using convention over configuration, Spring Boot Actuator implements a sensible set of health checks based on the infrastructure services used by the service. If, for example, a service uses a JDBC DataSource, Spring Boot Actuator configures a health check that executes a test query. Similarly, if the service uses the RabbitMQ message broker, it automatically configures a health check that verifies that the RabbitMQ server is up. You can also customize this behavior by implementing additional health checks for your service. You implement a custom health check by defining a class that implements the HealthIndicator interface. This interface defines a health() method, which is called by the implementation of the /actuator/health endpoint. It returns the outcome of the health check.
log aggregation pattern
Aggregate the logs of all services in a centralized database that supports searching and alerting.
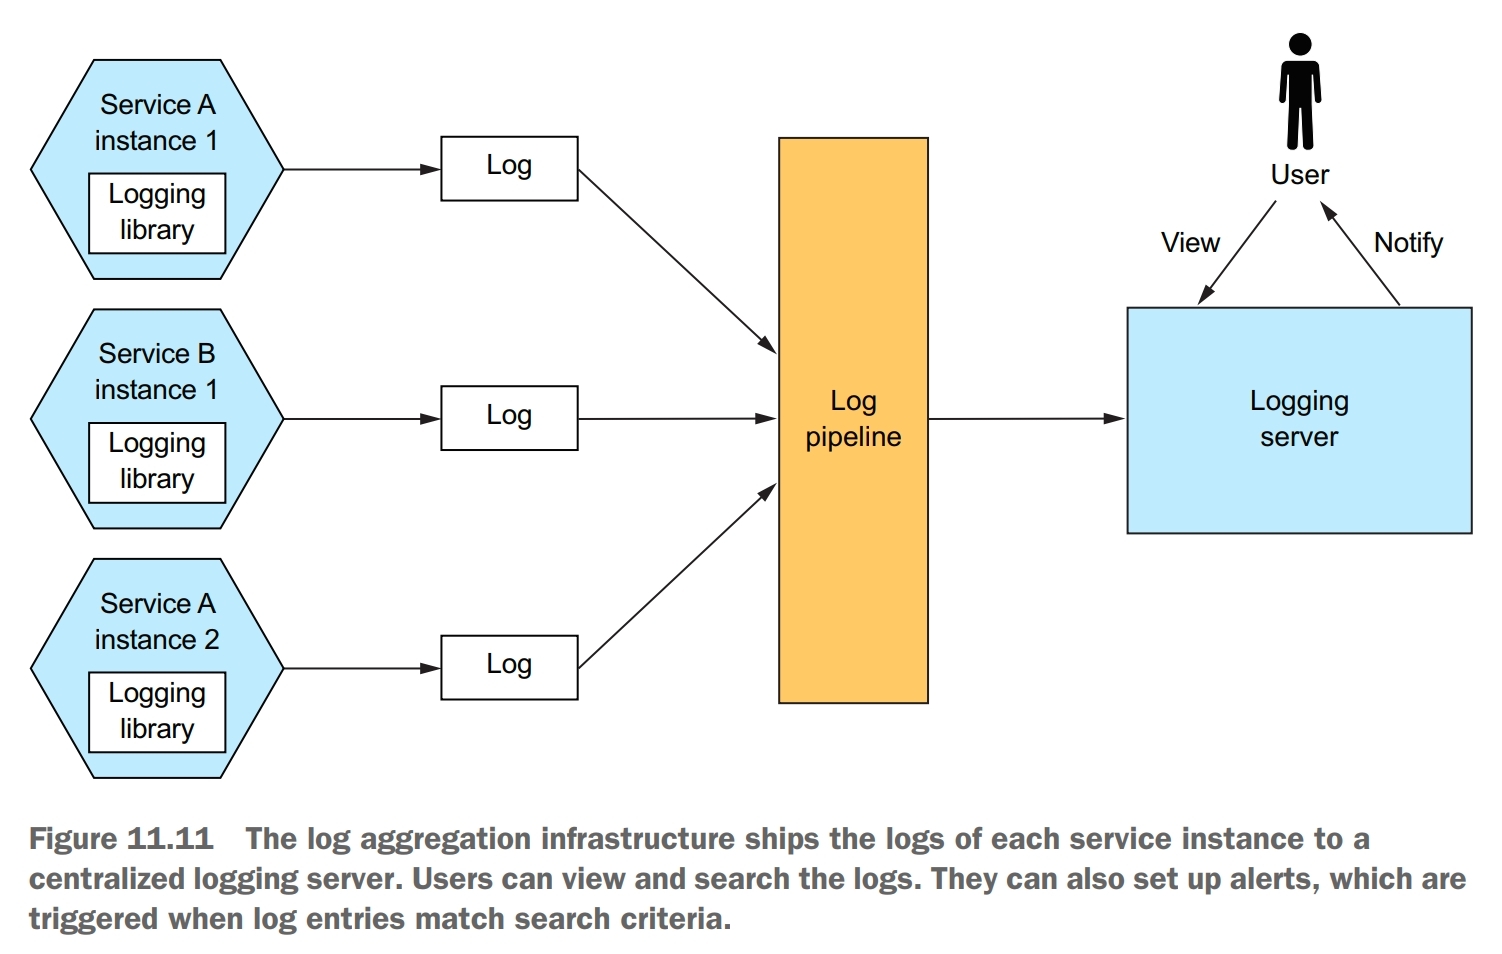
The log aggregation pipeline sends the logs of all of the service instances to a centralized logging server. Once the logs are stored by the logging server, you can view, search, and analyze them. You can also configure alerts that are triggered when certain messages appear in the logs.
Most programming languages have one or more logging libraries that make it easy to generate correctly structured log entries. For example, three popular Java logging libraries are Logback, log4j, and JUL. There’s also SLF4J, which is a logging facade API for the various logging frameworks.
You also need to decide where to log. Traditionally, you would configure the loging framework to write to a log file in a well-known location in the filesystem. But with the more modern deployment technologies, such as containers and serverless, this is often not the best approach. Instead, your service should log to stdout. The deployment infrastructure will then decide what to do with the output of your sercive.
The logging infrastructure is responsible for aggregating the logs, storing them, and enabling the user to search them. One popular logging infrastructure is the ELK stack. ELK consists of three open source products:
- Elasticsearch, a text search-oriented NoSQL database that’s used as the logging server
- Logstash, a log pipeline that aggreates the service logs and writes them to Elasticsearch
- Kibana, a visualization tool for Elasticsearch
distributed tracing pattern
Assign each external request a unique ID and record how it flows through the system from one service to the next in a centralized server that provides visualization and analysis.
A good way to get insight into what your application is doing is to use distributed tracing. Distributed tracing is analogous to a performance profiler in a monolithic application. It records information about the tree of service calls that are made when handling a request. You can then see how the services interact during the handling of external requests, including a breakdown of where the time is spent.
A trace represents an external request and consists of one or more spans. A span represents an operation, and its key attributes are an operation name, start timestamp, and end time. A span can have one or more child spans, which represent nested operations. For example, a top-level span might represent the invocation of the API gateway. Its child spans represent the invocations of services by the API gateway.
A valuable side effect of distributed tracing is that it assigns a unique ID to each external request. A service can include the request ID in its log entries. When combined with log aggregation, the request ID enables you to easily find all log entries for a particular external request.
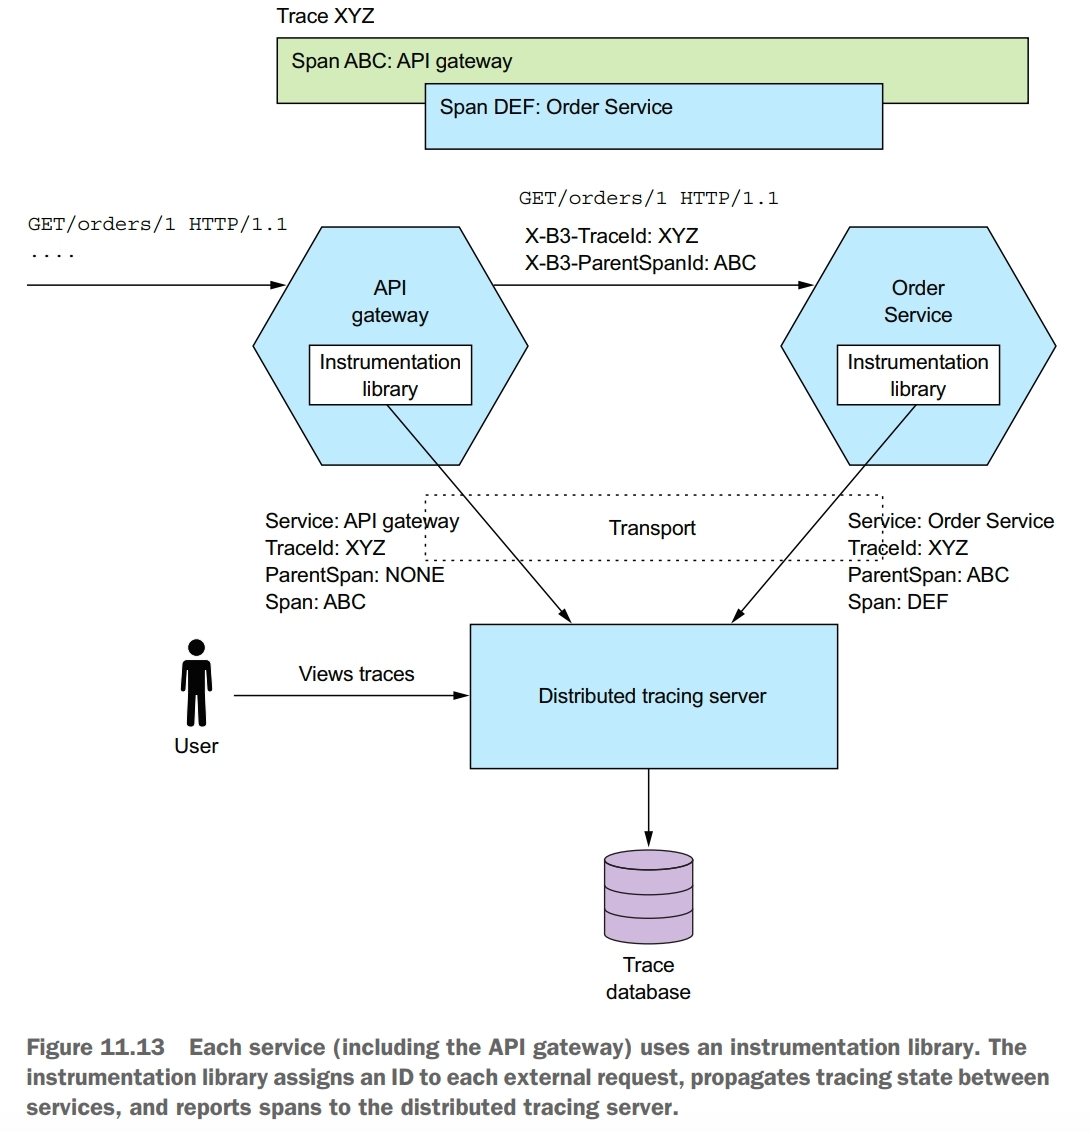
There are two parts to distributed tracing: an instrumentation library, which is used by each service, and a distributed tracing server. The instrumentation library manages the traces and spans. It also adds tracing information, such as the current trace ID and the parent trace ID, to outbound requests. The instrumentation library also reports traces to the distributed tracing server. The distributed tracing server stores the traces and provides a UI for visualizing them.
A great example of an AOP-based framework is Spring Cloud Sleuth. It uses the Spring Framework’s AOP mechanism to automatically integrate distributed tracing into the service. One popular distributed tracing server is Open Zipkin.
application metrics pattern
Services report metrics to a central server that provides aggregation, visualization, and alerting.
A key part of the production environment is monitoring and altering. The monitoring system gathers metrics, which provide critical information about the health of an application, from every part of the technology stack. Metrics range from infrastructure-level metrics, such as CPU, memory, and disk utilization, to application-level metrics, such as service request latency and number of requests executed. The metrics are collected by a metrics service, which provides visualization and alerting.
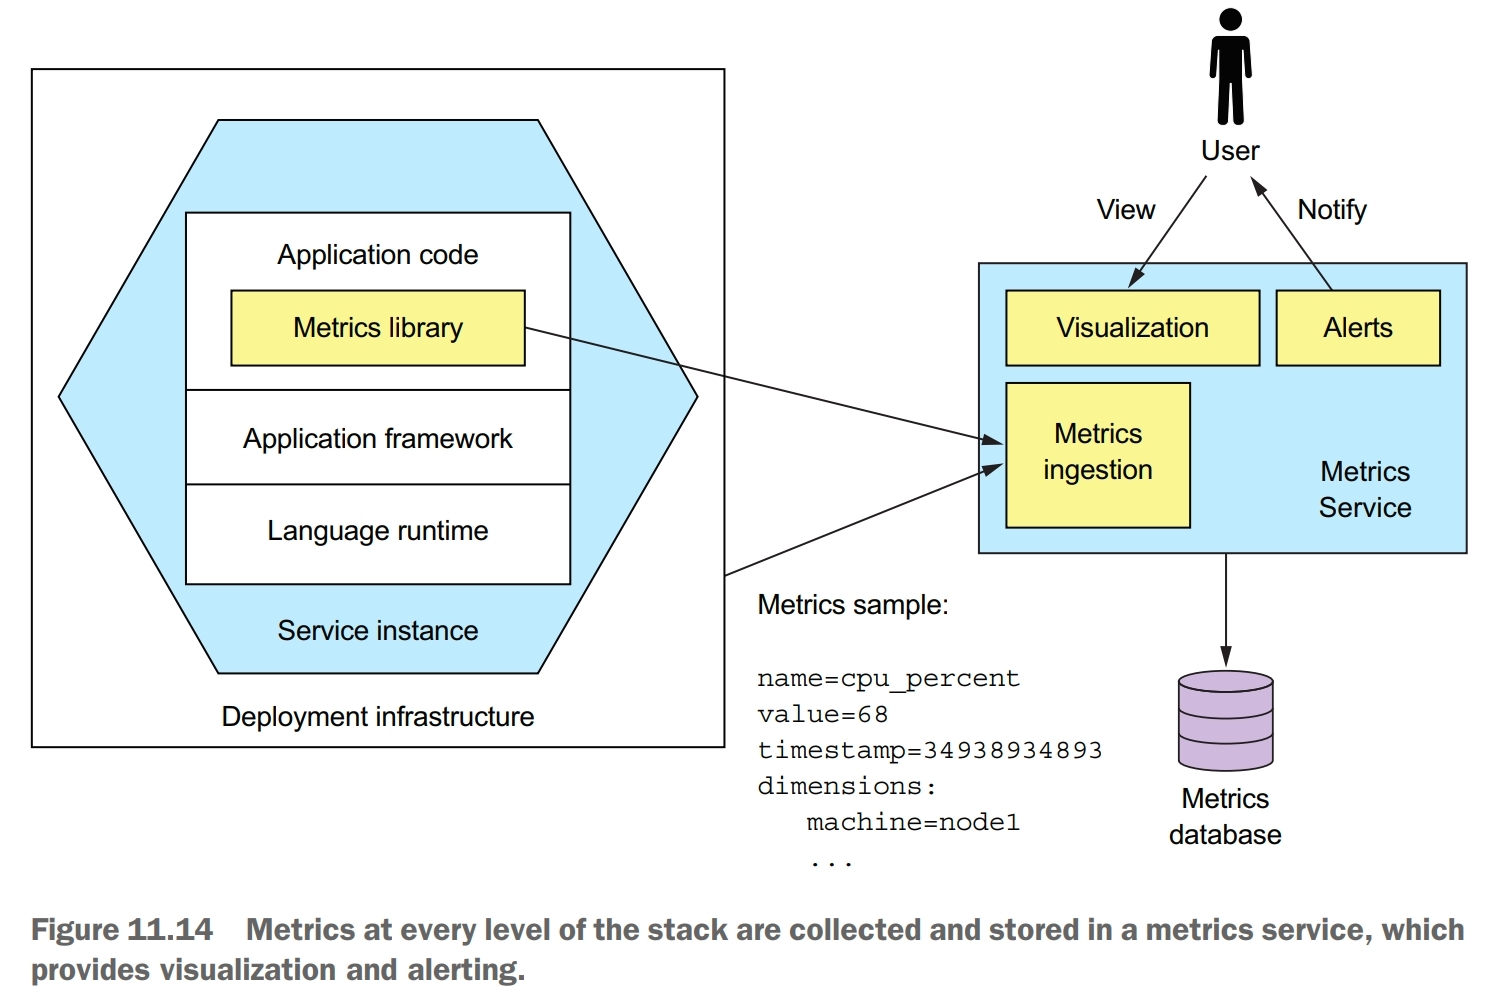
Many aspects of monitoring are the responsiblity of operations. But a service developer is responsible for two aspects of metrics. First, they must instrument their service so that it collects metrics about its behavior. Second, they must expose those service metrics, along with metrics from the JVM and the application framework, to the metrics server.
How much work you need to do to collect metrics depends on the frameworks that your application uses and the metrics you want to collect. A Spring Boot-based service can, for example, gather and expose basic metrics, such as JVM metrics, by including the Micrometer Metrics library as a dependency and using a few lines of configuration. Spring Boot’s autoconfiguration takes care of configuring the metrics library and exposing the metrics. A service only needs to use the Micrometer Metrics API directly if it gathers application-specific metrics.
A service delivers metrics to the metrics service in one of two ways: push or pull. With the push model, a service instance sends the metrics to the metrics service by invoking an API. With the pull model, the metrics service (or its agent running locally) invokes a service API to retrieve the metrics from the service instance. Prometheus, a popular open source monitoring and alerting system, uses the pull model. The Prometheus server periodically polls to retrieve metrics. Once the metrics are in Prometheus, you can view them using Grafana, a data visualization tool.
exception tracking pattern
Services report exceptions to a central exception tracking service that de-duplicates exceptions, generates alerts, and manages the resolution of exceptions.
![]()
There are a couple of ways to integrate the exception tracking service into your application. You service could invoke the exception tracking service’s API directly. A better approach is to use a client library provided by the exception tracking service.
audit logging pattern
Record user actions in a database in order to help customer support, ensure compliance, and detect suspicious behavior.
Each audit log entry records the identity of the user, the action they performed, and the business object. An application usually stores the audit log in a database table.
One option to implement audit logging is to use AOP. You can use an AOP framework, such as Spring AOP, to define advice that automatically intercepts each service method call and persists an audit log entry. This is a much more reliable approach, because it automatically records every service method invocation. The main drawback of using AOP is that the advice only has access to the method name and its arguments, so it might be challenging to determine the business object being acted upon and generate a business-oriented audit log entry.